

Public Data Resources for Tracking FAFSA Progress
Note - Unlike some other blog posts in this series, this post contains a lot of information that will be relevant to districts outside of Texas as well. None of the three sources include data on TASFA submission.
The Free Application for Federal Student Aid, more commonly known as the FAFSA, has been in the news a lot this school year, as there have been many changes and challenges. Contigo Ed has been tracking many of the recent updates in our Better FAFSA, Better Future blog post.
In today’s blog post, we will focus on what to do once you have overcome the hurdles and have had students submit the FAFSA. How can you track your progress? How does your district or campus compare to neighboring districts and campuses? How is the state of Texas doing compared to other states across the country? We will walk you through three public data sources that you can use to answer some of these questions.
As a note for our TX district partners, while these trackers are helpful as comparison tools, ApplyTexas will be your best resource for your most accurate, timely data on student-level FAFSA data.
TxCAN FAFSA Tracker
Please note that this tracker is only available for Texas. If you work outside of Texas, consider skipping to the next tracker.
Step 1: When you first get to the tracker, you will see the options below available to choose how you want to view the data. The data shown will be compared to the state's performance. For this example, we are going to choose "Region."

Step 2: On the right hand side of the tracker, you can then make the following selections:
Class year - for our example, we will select the class of 2024
ESC Region (under the region view) - we selected Corpus Christi and El Paso for this example, but you can select up to ten.
Pictured below is the resulting dashboard view. The bars are the state’s FAFSA submission rate, and the lines are each region’s. In this example, we can see that the two regions we have selected are ahead of the state for 2024 submission.

If you hover over the regional data markers, you can see the number of FAFSA’s submitted and the percentage of seniors that have submitted a FAFSA. While the screenshot says 2024 March, this is not the data from the end of the month, as at the time of pulling the screenshot for this blog post the tracker was last updated on March 1st.

The NCAN FAFSA tracker offers many different views for comparing data. Unlike the TxCAN tracker, this tracker has data available for all states, not just Texas.
Step 1: We will focus on the “City, District, School Tables” available in the menu bar for this example.

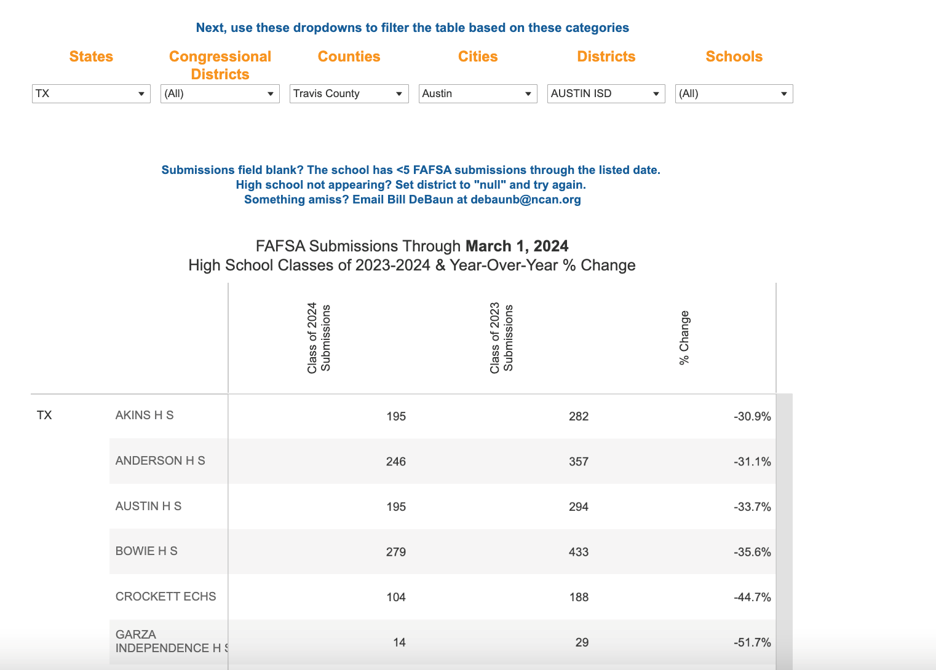
Step 2: You are now given the option to select the state, cities, districts, and/or schools you are interested in. For this example, we will select Texas for the state and Austin ISD for the district.

In the example below, we can see that an estimated ~36% of Austin ISD seniors have submitted the FAFSA, behind where the district was at this time last year. In the very right column, we see the same data for different high schools within Austin ISD.

Step 3: You can hover over the reported percentages to see more detailed information on submission. This is also where you can see when the data was last updated.

Alternatively, you can also select “High School Lookup” from the original drop-down menu and then select “Austin ISD” to see this data for the district's high schools in a different format.
Step 4: This step will allow you to compare how your state is doing in comparison to other states. To do this, return to the “Home Page” among the menu options, and then scroll towards the bottom of the page. You will see states ranked by 1) the percentage of seniors with a submitted FAFSA (on the left) and 2) the change in year-over-year submission rates (on the right). At the time this data was pulled, Connecticut had the highest percentage of seniors submitting the FAFSA.

This data source is the least user-friendly of the three we are highlighting as it only provides you with the raw data. However, it will be the best source for getting historical data as it has FAFSA completion and submission data back to 2016. Both the NCAN and TxCAN FAFSA trackers use similar underlying data for their trackers.
Step 1: The easiest data on this website to use is the data broken out by state, as this will help to narrow down your data set to your state of interest. If you choose to pull the data by year, then you will see all schools across all states. To select a state, click the down arrow next to “FAFSA Data by State/Territory”. A list of states will then appear, and when you select your state, an Excel spreadsheet will download automatically.

Step 2: The spreadsheet has four tabs, but the first two will likely be of the most interest to you. These two tabs show the data broken down by school and district.

Unfortunately, if you choose the “School” tab, there is no “District” filter, so you must scroll through all the schools and select the schools in your district and/or the schools of interest. You can help to narrow down the schools by first selecting all the cities in your district or cities of interest (click on the arrow in the box).

If you choose the district-level data tab, you can select your district by clicking on the arrow in the district name box.

Step 3: You can now compare the submission data for your district and/or campuses. As of mid-March, completion data was not yet available for this year.
Differences in Data Sources
Don’t be concerned if, after looking at all three data sources, you realize the numbers differ from your internal data and/or the three sources vary slightly. The numbers might differ from your internal data for reasons such as the following: 1) sometimes there are issues matching student names and certain applications are not shown in the data as submitted; 2) if you are a Texas district your internal data may include TASFA submission which none of the trackers include; and 3) your internal data might be more recent than what’s being reported on the tracker. Some trackers might have different completion numbers because 1) the data is from different sources, and 2) they use different denominators as estimates for your number of seniors. Even with slightly differing numbers, these data sources should give you a general sense of how your district and/or campus is doing and how this data compares to other districts, campuses, etc..
We encourage you to familiarize yourself with all three sources and hope that you find them helpful. If you want help comparing the submission data and/or are interested in a deep dive into FAFSA data, feel free to reach out to noa@contigoed.org. We are happy to help!