

College Enrollment Data Sources (NSC & THECB)
Note - Unlike many of the other blog posts in this series, this post contains a lot of information that will be relevant to districts outside of Texas as well. We will focus on both the National Student Clearninghouse (NSC) and the Texas Higher Education Coordinating Board (THECB)
At the end of the 2022-2023 school year, we celebrated the class of 2023 as they walked across the stage and got their diplomas. Many of these students had aspirations to continue their education in college, and if you are wondering if they ended up pursuing these plans, data reports from sources like National Student Clearinghouse (NSC) and the Texas Higher Education Coordinating Board (THECB) can help you to answer this question.

Brief Guide to National Student Clearinghouse (NSC)
Background on NSC
National Student Clearinghouse collects student enrollment records from 3,600 postsecondary institutions which as of 2019 represents 97% of the nation’s postsecondary enrollments at degree-granting institutions. The cost per high school per year is $595/school which can be a worthy investment if you are aiming to improve your school’s or district’s college enrollment rates.
Data Upload Schedule
Each fall, schools / districts upload their most recent graduate roster to NSC. If you haven’t already, now is a good time to go ahead and do so. Here is the NSC upload guide and directions. In return, three times a year (November, April, and August) NSC produces reports with updates on your graduates’ college enrollment and persistence. These reports include both a detailed student-level file with students’ enrollment history for each semester and a few summary files with aggregate data.
Overview of select NSC reports / files
Of the files and reports NSC provides back to your school or district, below is an overview of the files we use most.
StudentTracker® Detail Report - This is a student-level file with multiple rows per student showing their enrollment status by semester. You can use this file to identify specific students and see if / where they enrolled in college. Contigo Ed often works with districts to analyze this file for data on persistence and attainment as well. This is the file you would use if you are looking to connect student-level college enrollment data to other school or district student-level data for analysis.
Note: Due to FERPA blocks, you may find that the % of students enrolling in college in the “DETAIL” file is lower than the data reported in the other summary reports. This is because for these students their enrollment records are being protected. We find that FERPA blocks tend to be most associated with certain institutions; for example, Texas Tech is an institution for which there are many FERPA blocks in the student-level data.
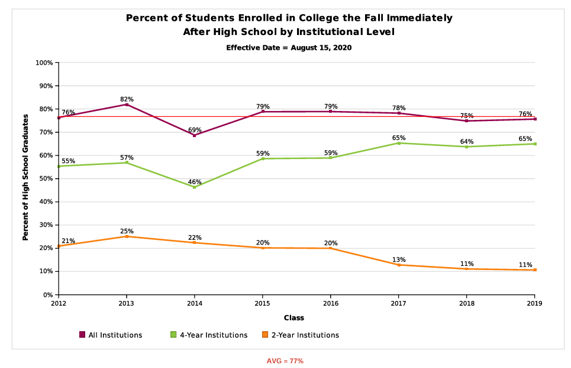
StudentTracker® Aggregate Report - This file can be found in the format of a summary PDF or Excel. It summarizes student information at an aggregate level across an entire graduating class (vs. at the student-level). For example, below are two snapshots of sample graphs from a district’s aggregate report, and here is an entire sample Aggregate Report.
1. [Example] Percent of Students Enrolled in College the Fall Immediately After High School
2. [Example] Percent of High School Class Who Completed a Degree Within Six Years

StudentTracker® Demographic Report - This report resembles the Aggregate Report; however, it also allows you to see this data broken down by demographics such as race / ethnicity and gender. Please note that to receive data in this report your school / district has to upload demographic data in your Graduate Roster.
[Example] By Gender - Percent of Students Enrolled in College the Fall Immediately After High School

If you want to know how your graduates' college enrollment rates compare to data nationally, NSC produces annual college enrollment reports that can be found here.

Introducing the Texas Higher Education Coordinating Board (THECB) Public College Enrollment Data (Texas-specific)
Background on THECB Public College Enrollment Data
While NSC is likely the best resource for college enrollment data (outside of data-sharing agreements with your local colleges), there are limitations. Perhaps your district does not have the funding to set up an NSC contract, or perhaps you are looking to compare your college enrollment data to your neighboring districts or the state overall. This is where our team then leans on public college enrollment data through THECB (here).
A few important notes about using THECB college enrollment data:
This data is limited to TX public and independent higher education institutions. Students that enroll out of state are NOT captured in this data so this report will under-report your college enrollment rate by a few percentage points compared to your NSC data (which does capture out-of-state students).
While with NSC data you can often investigate your college enrollment rates the following Fall, THECB public college enrollment data is often delayed by more than a year (e.g., enrollment data for the class of 2022 is only now available in late Fall 2023).
Overview of Data
Here is where you can find the various download options for THECB college enrollment data (see screenshot below). Data is available down to the district-level, and even the school-level. Once you select a report, you will be taken to a page where you can select the graduating class you want the data for. THECB has data back to 2002 graduates.

Once you open up the THECB college enrollment data reports, you will see that for each district or school the data is broken down by the most popular institutions students enrolled at. As for how we typically use this data to calculate fall college enrollment rate, we remove the “not trackable” students from the denominator (total graduates).
Note: Institutions at which fewer than 5 students from the school / district enrolled are masked and grouped into a catch-all row for that district (i.e., “Other Pub/Ind 4-yr Institution”).
As an example of how you might use this data, below is a list of the 5 districts in the state (with at least 500 graduates) that saw the highest increase in college enrollment rates from the class of 2019 to the class of 2022.

If your district is interested in diving into your NSC or public college enrollment data in more detail, needs help submitting graduate rosters, and/or needs help getting a contract set up with NSC, feel free to reach out to noa@contigoed.org as we are happy to help and have done this work for many districts.